
📉 Denial Impact Map™ – Your Clear Path to Fixing the Biggest Revenue Leaks
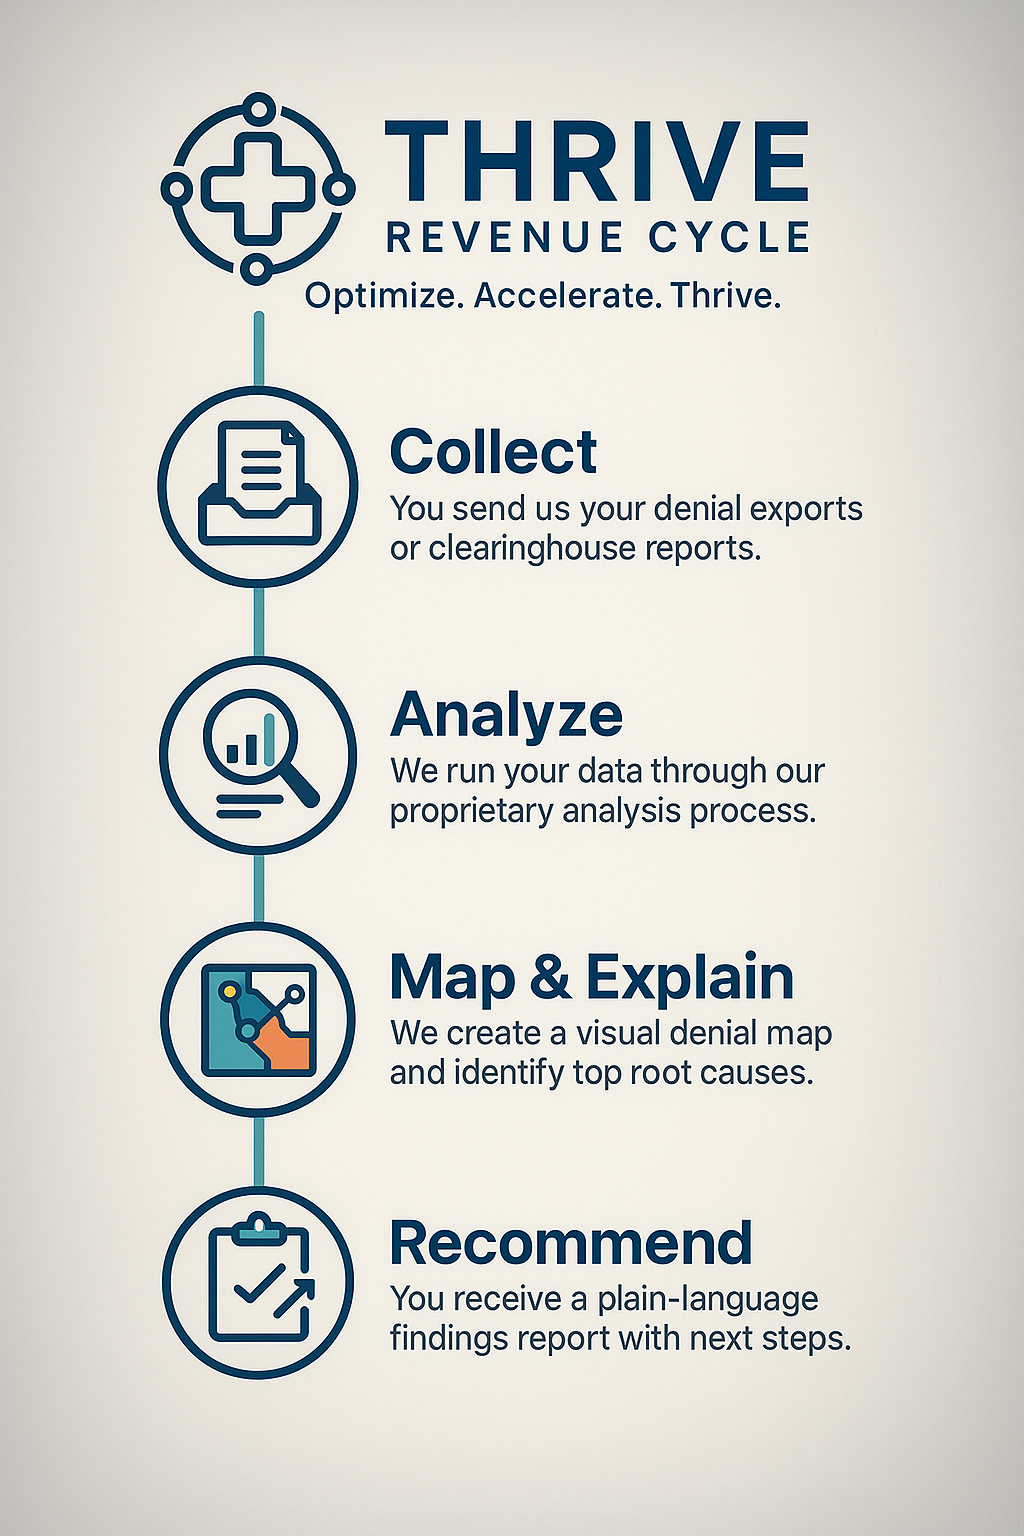
We collect and analyze your denial data—then deliver visual maps, root cause insights, and clear next steps for getting paid faster.
❗ The Reality for Most RCM Teams
- Staff can’t tell which denials to fix first
- Denial data is buried or vendor-controlled
- Leaders lack visual clarity to approve changes
- Payer patterns go undetected until revenue dips
- Audit risk builds with unresolved denial trends
Common frustrations include:
- ❌ Growing denials with no clear explanation
- ❌ Vendor reports that hide or oversimplify real denial causes
- ❌ Time wasted pulling and sorting raw data
- ❌ No visual story to get leadership on board
When to Choose The Denial Impact Map™
The Cost of Not Acting
Without the Impact Map:
- Delayed revenue and cash flow strain
- Repeat denials for the same causes
- Missed patterns that trigger payer audits
- Lower staff efficiency and morale

With the Impact Map:
- Your top denial drivers revealed in days
- Root causes linked to workflows or payer rules
- Actionable recommendations—no guesswork
- A clear, visual tool to rally your team and leadership
Meet The Denial Impact Map™
We do the heavy lifting:
How It Helps Leaders
- Pinpoint the top 3–5 denial drivers by code, payer, or workflow
- Understand potential audit risks before they escalate
- Use data visuals to support staffing or process changes
- Prioritize fixes for the fastest ROI
- Build a case for new technology or vendor changes
What’s Included
🧭 Impact Lite™ ($199)
Quick Visual Snapshot of Denial Hotspots
Ideal for rapid insight into your top denial categories, the Impact Lite™ offers a clear, visual overview of what’s costing you most—without heavy analysis. Perfect for presentations, board meetings, or triage planning.
✔ 1-Page Visual Denial Heatmap (Top 5 Denials)
✔ Red/Yellow/Green Grading for Denial Severity
✔ 3–5 Actionable Recommendations
✔ Delivered in 5 Business Days
✔ Data Pull Guidance Included
🧭 Impact Deep Dive™ ($425)
Root Cause Clarity & Strategic Guidance
Go beyond the visual. This full denial analysis maps root causes by code, payer, modifier, department, and reason—equipping your team with detailed insights and a roadmap for process improvement.
✔ Everything in Lite
✔ Multi-Page Visual Report
✔ Root Cause Breakdown by CPT, Modifier, Reason, Payer, and Department
✔ Workflow & Policy Mapping
✔ Priority Ranking of Fixes
✔ Optional 30-Minute Review Call
Results You Can Expect
- Detect denial patterns months earlier
- Reduce repeat denials by 10–15% within 90 days (avg client)
- Recover high-dollar claims that would have been written off
- Equip your team with visual proof for operational changes

The Impact Map revealed $27K in denials tied to a single workflow gap—something our vendor never flagged
Mona R
Billing Director
Visual Denial Analytics Made Simple.
Choose your level of insight. The Denial Impact Map™ helps you identify denial causes, top codes, and operational risks through a clean, visual report. Start simple with the Lite version or unlock expert strategy and Excel tools with the Full version.
✔ 1-Page Visual Denial Heatmap (Top 5 Denials)
✔ Red/Yellow/Green Grading for Denial Severity
✔ 3–5 Actionable Recommendations
✔ Delivered in 5 Business Days
✔ Data Pull Guidance Included
Quick Visual Snapshot of Denial Hotspots
🧭 Impact Deep Dive™
✔ Everything in Lite
✔ Multi-Page Visual Report
✔ Root Cause Breakdown by CPT, Modifier, Reason, Payer, and Department
✔ Workflow & Policy Mapping
✔ Priority Ranking of Fixes
✔ Optional 30-Minute Review Call
Root Cause Clarity & Strategic Guidance
Zero-Risk Guarantee
If your Denial Impact Map™ doesn’t give you at least three actionable insights within 30 days, we’ll refund your purchase—no questions asked.